Export a Crosstab CSV
The CSV export of the crosstab results is organized by Control, Column, and Row, in that order. The variable names display as the first 1, 2, or 3, column headers. This feature is available for both PDAS and RDAS.
- After running a crosstab, click the Full Crosstab as CSV link below the table in the Export section.
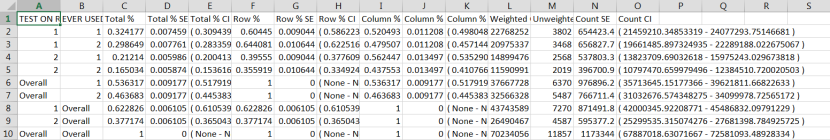
- The data exports to a CSV file, which opens in Microsoft Excel.
NOTE: All related data will automatically display in the CSV file, even if the checkboxes (such as Confidence Intervals and Standard Errors) were unchecked in the results.
- To create graphs based on this data, perform the following:
- Delete any columns or rows that you do not want to display on the graph. For example, if you do not want the totals on the graph, then delete the "Overall" rows.
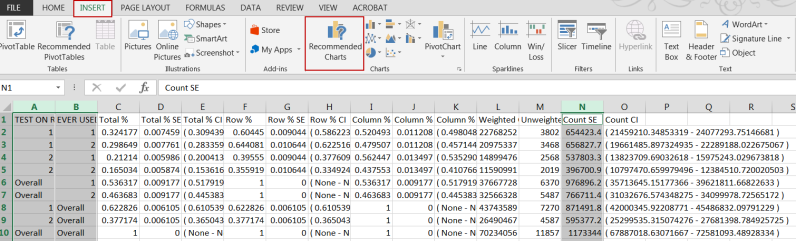
- Highlight the appropriate columns (click the letter above the column header to highlight the entire column) and hit CTRL to select multiple columns.
- Under the Insert tab on the ribbon, click Recommended Charts.
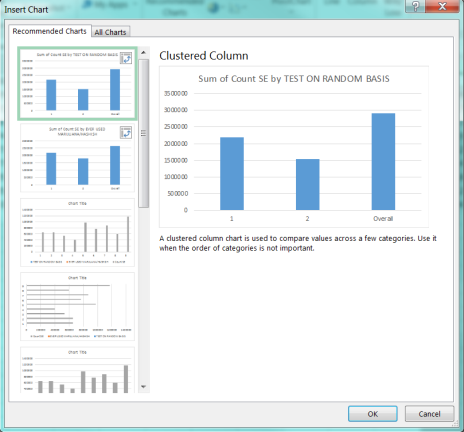
- On the Insert Chart window, select the appropriate chart type and click OK.
- The chart and related data display on a new worksheet.
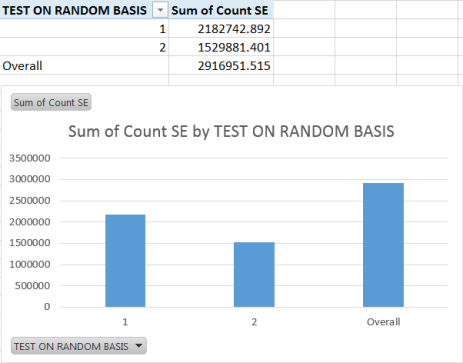
- Further manipulate the graph by using Excel functions. Or right-click the graph and select Change Chart Type or Select Data.
NOTE: Refer to the Microsoft Excel help for more information on manipulating graphs.